Google Analytics is a powerful tool that can help you track the performance of your funnel or website. One of the most useful features of Google Analytics is its ability to track funnel conversions.
GA funnel analysis is a process of analyzing your website’s conversion rate from one page to another. You can use this feature to identify where visitors are dropping off and how to improve your conversion rate. The Google Analytics variables and settings can adjust data for the necessary metrics.
Google Analytics is an advanced tool that can help anyone who wants to track their online performance. In the next section, we’ll get into the details of Google Analytics and its funnel analysis capabilities.
Funnel Analysis in Google Analytics – Basics
Google Analytics funnel analysis evaluates conversions from one step of your funnel to the next. The feature shows areas of improvement and distractions within your pages to boost conversions.
Although it’s called “funnel analysis,” you don’t need a sales funnel to use this feature.
You can use GA to track any conversion, such as sign-ups for a newsletter or PDF downloads.
1. How Do I Create a Funnel in Google Analytics?
If you want to create a funnel in Google Analytics, here are the steps to follow:
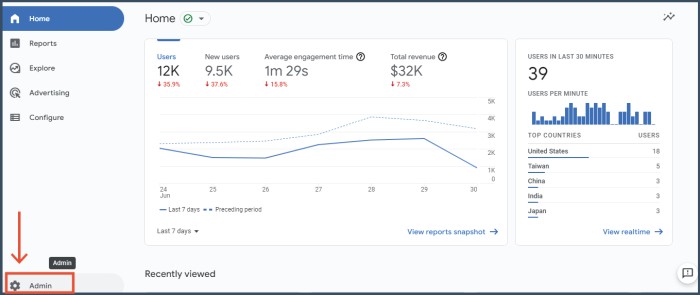
1. First, log into your Google Analytics account and navigate to the “Admin” section.
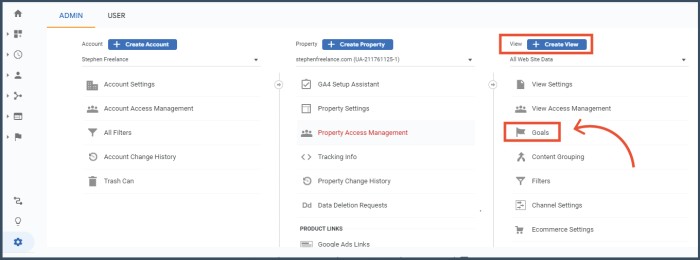
2. Next, click on “Goals” under the “View” section.
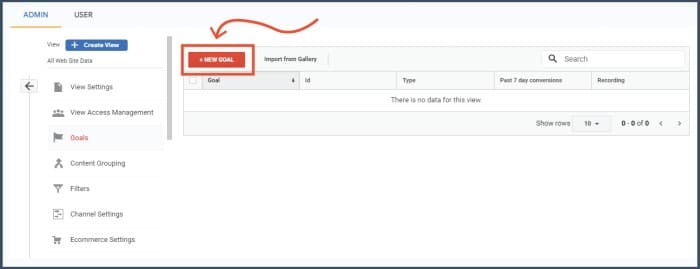
3. Then, click on the “New Goal” button. This will open up a pop-up window where you can customize your goal.
4. A new tab that allows you to set up your goal settings will appear. You can select templates and/or customize your goal.
If you select the template, you will skip the “Goal Description” because it will automatically fill out.
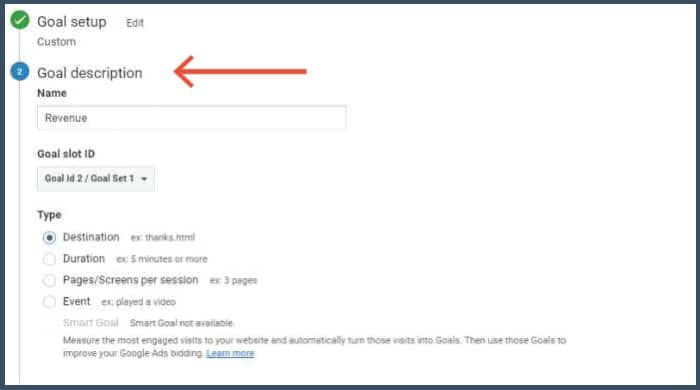
5. If you go the custom route, you should give your goal a name and choose the goal type.
This could be “Destination,” “Duration,” “Pages/Screens per Session,” “Event,” or “Smartphone App Installs.”
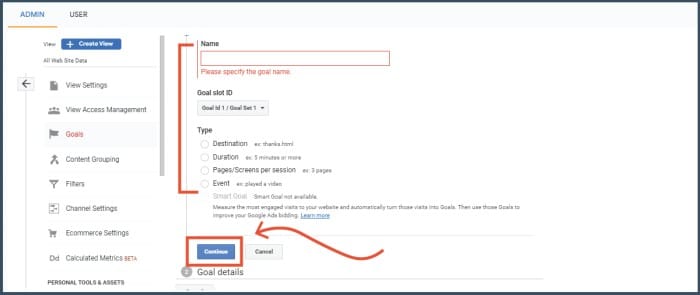
6. After that, click on the “Continue” button.
7. The next step is to configure your goal details. For a Destination goal, you need to enter the URL of the final page of your funnel.
For a Duration goal, you need to enter the amount of time you want visitors to spend on your site.
For a Pages/Screens per Session goal, you need to enter the number of pages or screens you want visitors to see.
And for an Event goal, you need to enter the event’s category, action, and label.
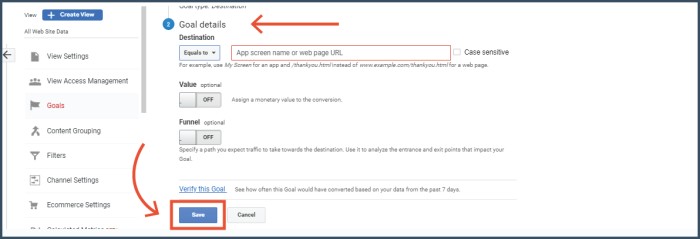
8. There is also an option to assign value to your goal. For example, you could assign a value to a newsletter sign-up.
This is an optional step, but it can be helpful if you want to track the monetary value of your goals.
9. Once you’ve entered all the goal details, click on the “Save” button.
And that’s it! You’ve now successfully created a funnel in Google Analytics.
2. How Do I Perform Funnel Analysis in Google Analytics?
After creating a funnel, you can analyze your website’s performance. Let’s explore how to do that.
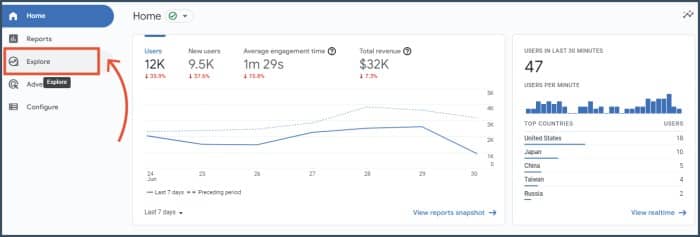
1. First, log into your Google Analytics account and navigate to the “Explore” section.
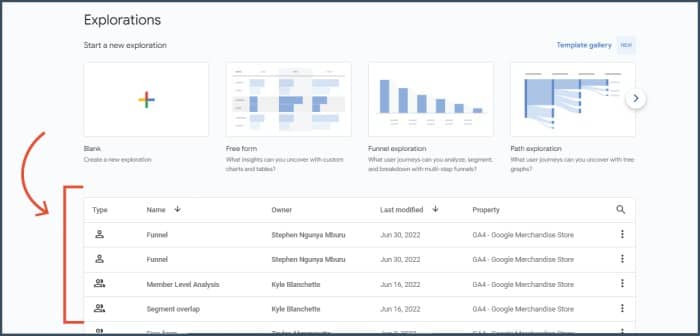
2. Next, select the funnel you want to analyze from the ones you have created.
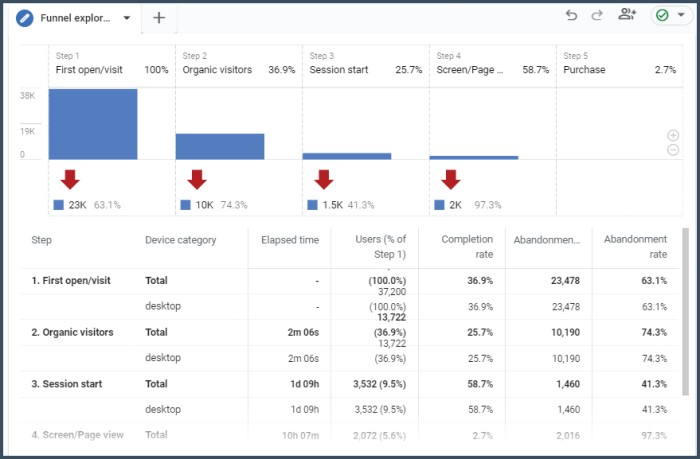
3. This will bring you to the funnel analysis page, where you can see your website’s conversion funnels.
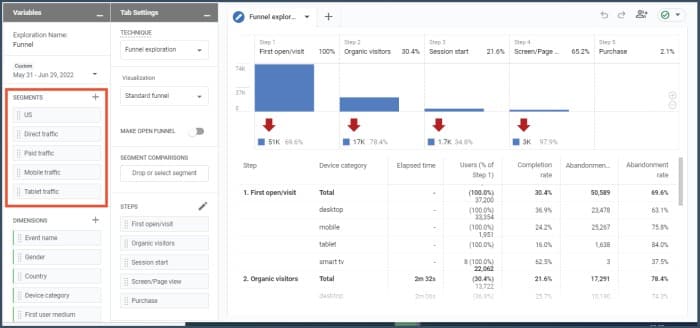
4. You can adjust the variables of your funnel analysis by changing the date range, comparing two date ranges, or adding a segment.
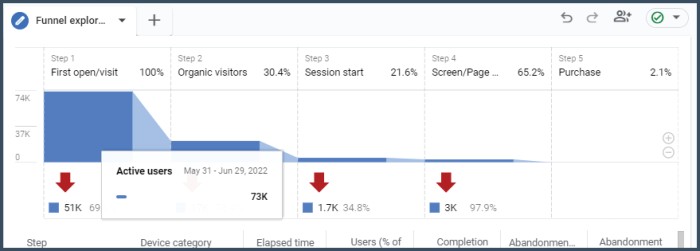
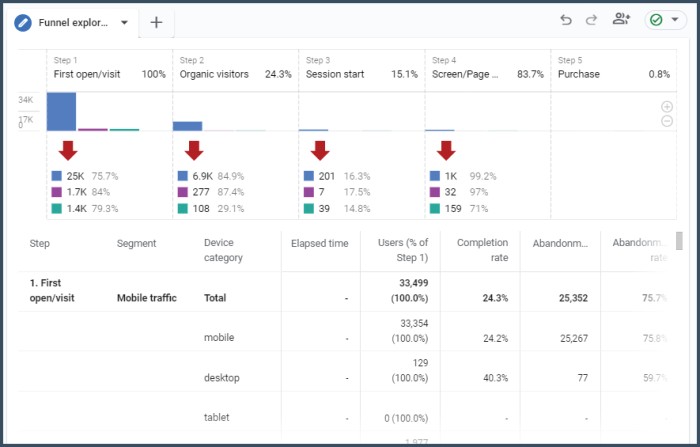
5. The funnel has different steps (depending on what your goal is).
The first step could be “First Open/visit,” but others proceed to visit your product catalog.
Next, you can have a step that involves adding products to the cart. Lastly, you can have a purchase step.
Below the funnel, there are different parameters that you can use to further segment your data. One such metric is the devices.
Your web visitors can use different devices to visit your website (e.g., desktop, mobile, tablet).
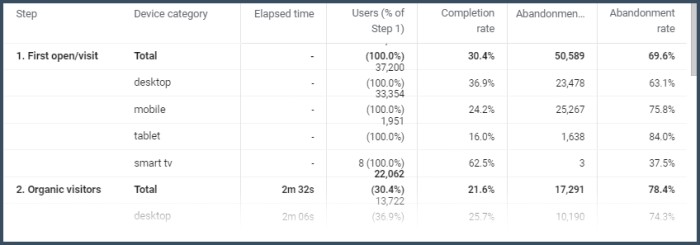
Some metrics show the percentage of conversions for each device type.
You can use the data to identify which devices are converting well and which ones need improvement.
Apart from that, the percentages also show the number of visitors that proceed from one stage to the next on different devices.
This helps you identify which devices have a high drop-off rate and where that occurs.
You can also include or exclude certain devices from your analysis by clicking on the “Include/Exclude” button.
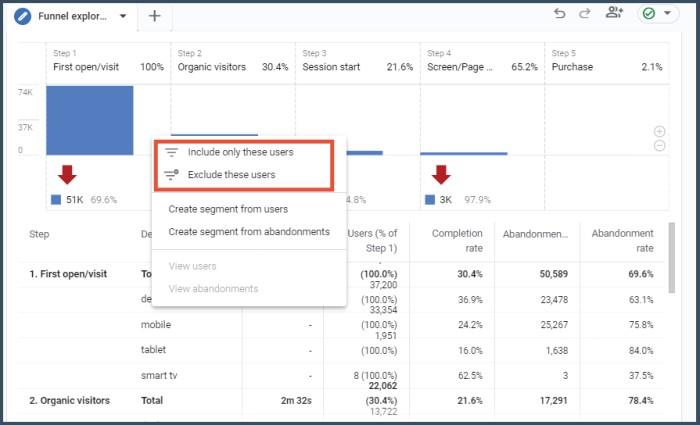
For example, you could exclude mobile traffic if you want to focus entirely on desktop traffic. To do this, follow the steps below.
- Right-click above the device you want to include, and click on the “Include these users only.” You will exclude all the other devices from the analysis.
- If you want to exclude a specific device, click on the “Exclude these users” button right above the device. The data for that particular device will no longer appear in your analysis.
Google Analytics funnel tracks the performance of the traffic in each step.
Our next section will cover how to use different variables and settings to analyze your GA funnels.
How Google Analytics Funnel Analysis Works?
It’s essential to look at different variables and tab settings to understand how they affect your data.
There are four primary variables that you can adjust in your GA funnel analysis:
- Period
- Segments
- Dimensions
- Metrics
1. Period
The “Period” variable allows you to select the date range of your data.
This is helpful if you want to compare data from different periods or see how your website’s performance has changed over time.
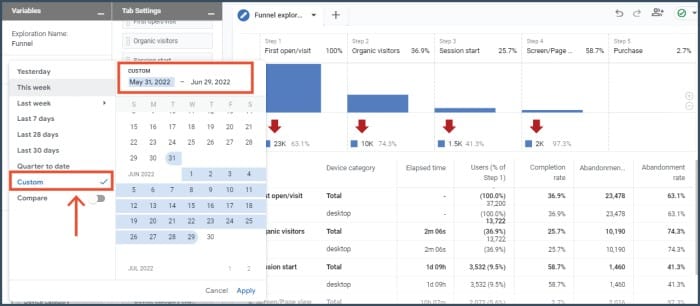
You can activate the comparison feature by clicking on the “Compare” checkbox. This will bring up a second date range selector.
You can then compare the data of your primary date range to that of your secondary date range.
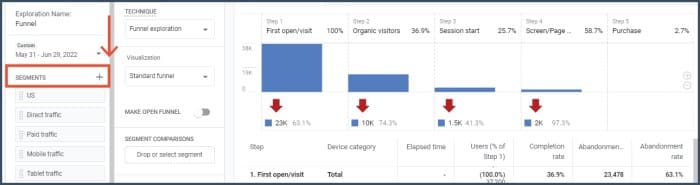
2. Segments
The “Segments” variable allows you to segment your data. This comes in handy if you want to drill down into specific groups of visitors.
For example, you could segment your data by traffic source (e.g., direct, organic, social, etc.), device type (e.g., desktop, mobile, tablet), or geographic location (e.g., country, city).
Apart from that, you can also compare data between two segments. For example, you could compare the performance of your website’s organic and direct traffic.
To do this:
1. Identify the variables you want to compare. For example, it could be your mobile and tablet traffic.
2. Drag and drop the segment on the “Segment Comparison” section in the “Tab Settings.”
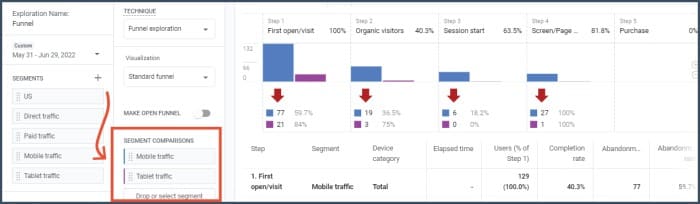
3. Data comparing the two segments will appear on the right side of your tab.
There are also different ways that you can segment your data. Experiment with different segments and see which are most helpful for your analysis.
Apart from the template segments, you can also create your custom segments. To add more segments, follow these steps:
1. Click on the “Add Segment” button.
2. A modal window will appear with different segment options. You can go for custom or pre-configured segments.
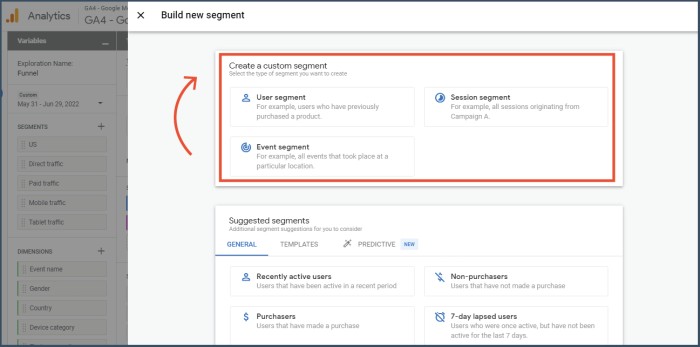
3. To create a custom segment, select the segment type from the three options (User, Session, or Event).
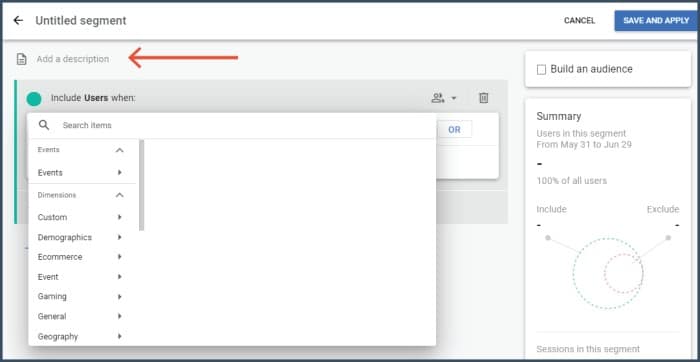
4. Fill in the segment description (condition to be met) and click on the “Create Segment” button.
The condition can be in the form of an event, demographic, e-commerce activity, session, or more. Apart from that, you can also customize the condition that needs to be met.
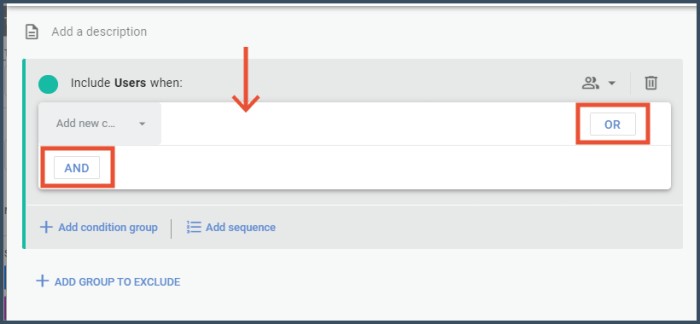
5. You can add more than one condition or exclude certain conditions by clicking on the “AND” or “Add Filter” buttons.
6. After creating the segment, click on the “Save and Apply” button on the top right of the tab.
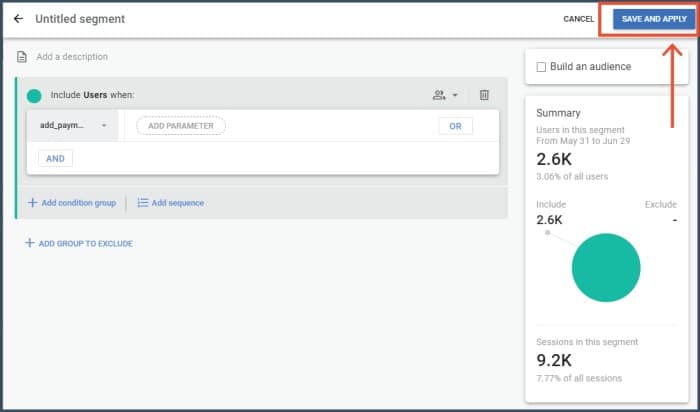
7. Lastly, you will be directed back to the funnel analysis with data filtered according to your segmentation.
3. Dimensions
The next variable is “Dimensions.” The dimensions in Google Analytics are the different attributes of your data.
For example, the dimension “Page” refers to the different pages on your website.
On the other hand, the dimension “Country” refers to the countries where your visitors come from.
You can use dimensions to further segment and analyze your data.
For example, you could segment your data by the dimension “Device Category” to see how your website performs on different devices.
To add a dimension to your funnel analysis:
1. Drag and drop the dimension you want to use from the “Dimension” section to the “Filters” in the “Tab Settings” area.
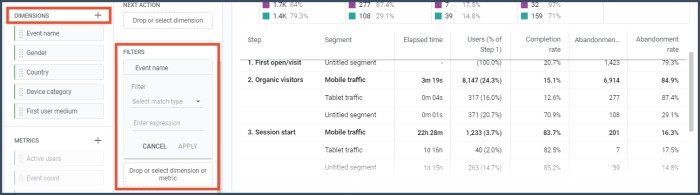
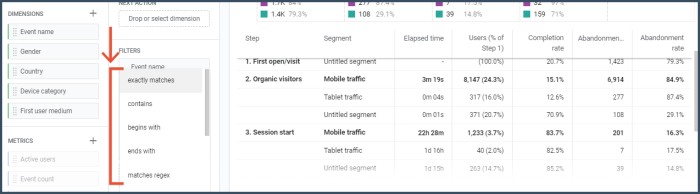
2. Next, select the match type from the drop-down menu. It could be “exact”, “contains”, “begins with”, “ends with” or “matches regex”.
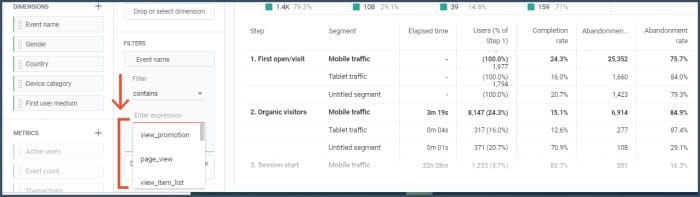
3. Lastly, add the “expression” from the list to filter your data and click “Apply.” You will get data on the right with the parameters you have selected.
4. Metrics
The last variable is “Metrics.” Metrics are the quantitative measures of your data.
For example, the “Sessions” metric refers to the number of sessions on your website.
On the other hand, the metric “Bounce Rate” refers to the percentage of visitors who leave your website after viewing only one page.
You can use metrics to calculate things like conversion rate or average order value.
Google Analytics Funnel Analysis Settings
Settings are the options you can use to customize your funnel analysis.
This section explores different options like visualization, open and closed funnel options, comparison, steps, elapsed time, next action, and filters.
Because we have discussed most of these in the previous section, we will only cover some of them here.
1. Visualization
The first option is “Visualization”. You can use this to change the way your data is displayed.
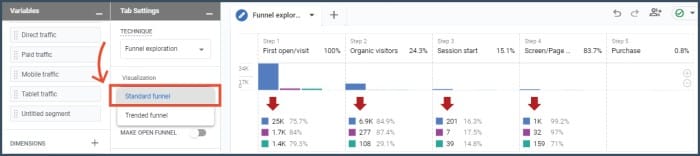
There are two options under this: standard and trended funnels. Standard funnels show you the number of visitors at each step of your funnel.
On the other hand, trended funnels display continuous data over time. This is useful if you want to see how your funnel changes over time.
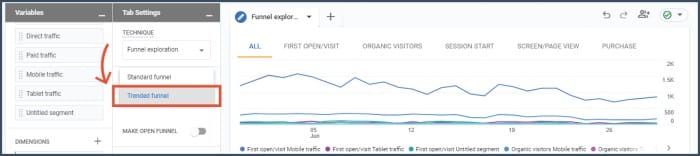
To change the visualization, click on the “Visualization” drop-down menu and select the option you want.
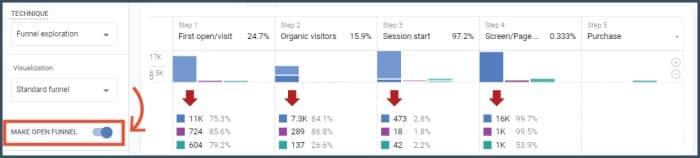
2. Open and Closed Funnel Options
One of the essential settings is the “Open and Closed Funnel Options.” By default, all funnels are set to “Closed.”
To help you understand this, let’s assume you have steps A, B, C, and D in your funnels.
| Buyer | Step A | Step B | Step C | Step D | Closed Funnel | Open Funnel |
|---|---|---|---|---|---|---|
| Buyer 1 | ✔️ | ✔️ | ✔️ | ✔️ | Included | Included |
| Buyer 2 | ✔️ | ✔️ | ✔️ | Not Included | Not Included | |
| Buyer 3 | ✔️ | ✔️ | ✔️ | Not Included | Included | |
| Buyer 4 | ✔️ | Not Included | Included |
In closed funnels, the data for step D will only include those who have completed all the steps (A, B, and C).
This means that if someone has started at step A but dropped off at step B, they will not be included in the data for step D.
Even if they rejoin the funnel at step C, they will still be excluded from the data for step D.
On the other hand, the open funnel allows users to join the funnel at any point.
This means that those who join the funnel at steps B, C, or D will still be included in the data for step D.
However, if one joins the funnel in step A but drops off before completing any other steps, they will not be included in the data for step D.
Even if they rejoined the funnel later on, they will still not be included. To change the open and closed funnel options, slide the “Make Open Funnel” switch.
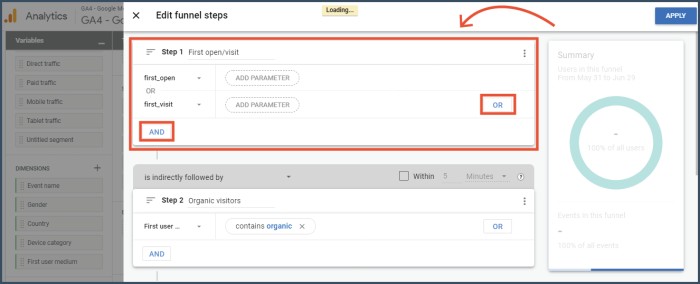
3. Steps
This setting allows you to change the number of steps in your funnel. You can add or remove steps by clicking on the “Add Step” or “Remove Step” buttons.
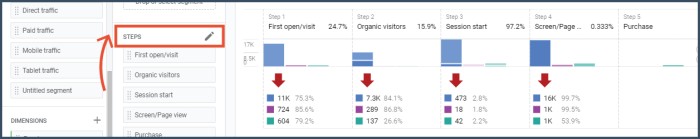
You can also include conditions or parameters that must be met for a step to be considered complete.
You can opt for independent or dependent conditions. For example, you can set the condition that a user must visit a specific page and click a link (dependent).
Independent conditions use the “OR” operator, while dependent conditions use the “AND” operator.
4. Elapsed Time
The “Elapsed Time” setting shows how long it takes users to go through your funnel. To enable this, slide the “Show Elapsed Time” switch.
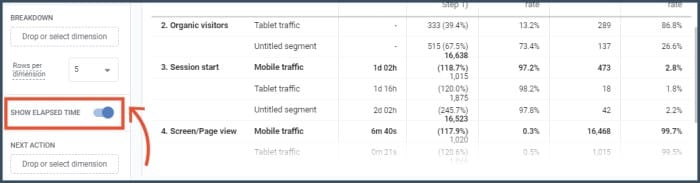
A new row will appear under your funnel, showing the time it takes for visitors to proceed to the next step.
The feature comes in handy when you want to know which step in your funnel takes the longest to complete.
5. Next Action
Do you want to see what users do after every step? The “Next Action” setting allows you to see the next page users visit after completing a step.
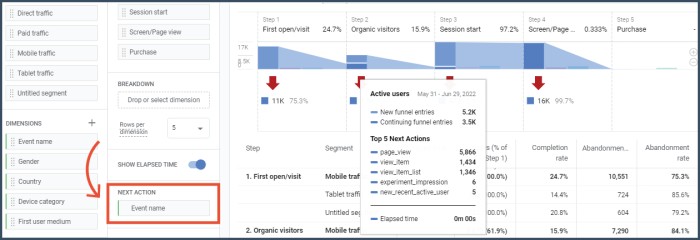
Although your intention might be to get users to complete the whole funnel, this setting can help you see what other pages they are interested in.
This can give you an idea of what other content you can create that might be relevant to them.
Apart from that, it helps you identify distractions that might be causing users to drop off.
To enable this feature, drag and drop the “Event Name” dimension to the “Next Action” area.
After that, if you hover the cursor over your funnel, you will see the next page users visit. All these settings help you customize your funnel to better suit your needs.
Experimenting with the different settings will help you see which combination works best for you.
Takeaway
Google Analytics funnel analysis is a powerful tool that can help you understand your users’ behavior.
By experimenting with the different settings, you can find the best combination for you and your business.
The variables in the funnel analysis are important, but they are not the only thing you should focus on.
Try to look at the bigger picture and see how your users interact with your website.
This will give you a better understanding of their needs and how you can improve your website to fulfill them.